4 Reasons Why Today’s Housing Market is NOT 2006 All Over Again! By The KCM Crew

With home prices rising again this year, some are concerned that we may be repeating the 2006 housing bubble that caused families so much pain when it collapsed. Today’s market is quite different than the bubble market of twelve years ago. There are four key metrics that explain why:
- Home Prices
- Mortgage Standards
- Mortgage Debt
- Housing Affordability
1. HOME PRICES
There is no doubt that home prices have reached 2006 levels in many markets across the country. However, after more than a decade, home prices should be much higher based on inflation alone.
Frank Nothaft is the Chief Economist for CoreLogic (which compiles some of the best data on past, current, and future home prices). Nothaft recently explained:
“Even though CoreLogic’s national home price index got to the same level it was at the prior peak in April of 2006, once you account for inflation over the ensuing 11.5 years, values are still about 18% below where they were.” (emphasis added)
2. MORTGAGE STANDARDS
Some are concerned that banks are once again easing lending standards to a level similar to the one that helped create the last housing bubble. However, there is proof that today’s standards are nowhere near as lenient as they were leading up to the crash.
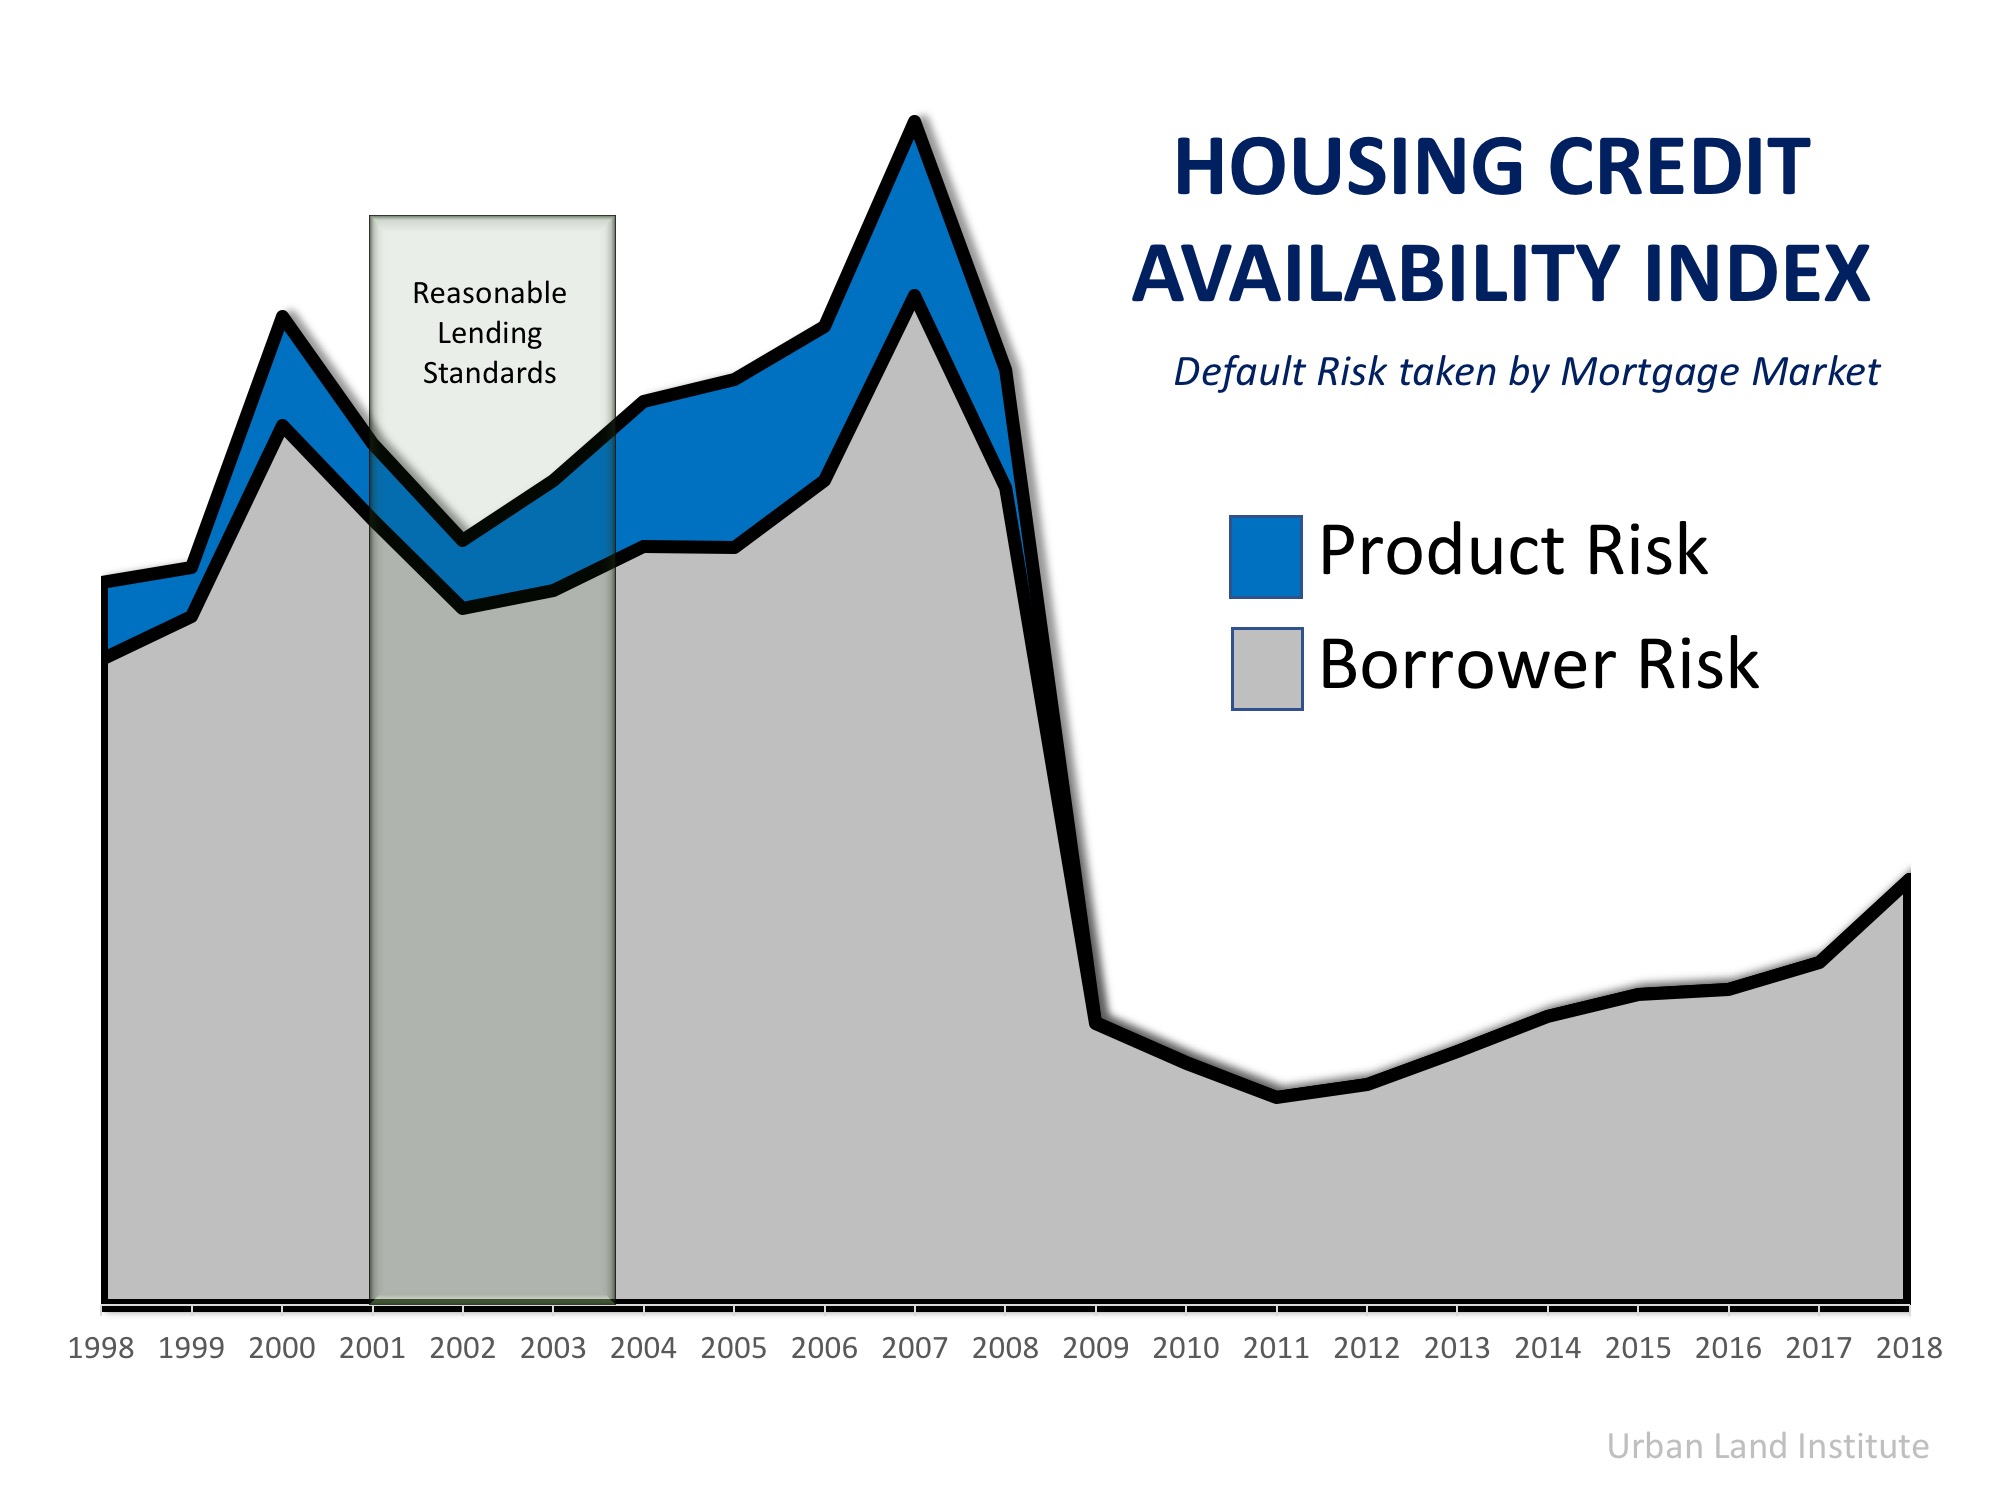
The Urban Institute’s Housing Finance Policy Center issues a Housing Credit Availability Index (HCAI). According to the Urban Institute:
“The HCAI measures the percentage of home purchase loans that are likely to default—that is, go unpaid for more than 90 days past their due date. A lower HCAI indicates that lenders are unwilling to tolerate defaults and are imposing tighter lending standards, making it harder to get a loan. A higher HCAI indicates that lenders are willing to tolerate defaults and are taking more risks, making it easier to get a loan.”
The graph below reveals that standards today are much tighter on a borrower’s credit situation and have all but eliminated the riskiest loan products.
3. MORTGAGE DEBT
Back in 2006, many homeowners mistakenly used their homes as ATMs by withdrawing their equity and spending it with no concern for the ramifications. They overloaded themselves with mortgage debt that they couldn’t (or wouldn’t) repay when prices crashed. That is not occurring today.
The best indicator of mortgage debt is the Federal Reserve Board’s household Debt Service Ratio for mortgages, which calculates mortgage debt as a percentage of disposable personal income.
At the height of the bubble market a decade ago, the ratio stood at 7.21%. That meant over 7% of disposable personal income was being spent on mortgage payments. Today, the ratio stands at 4.48% – the lowest level in 38 years!
4. HOUSING AFFORDABILITY
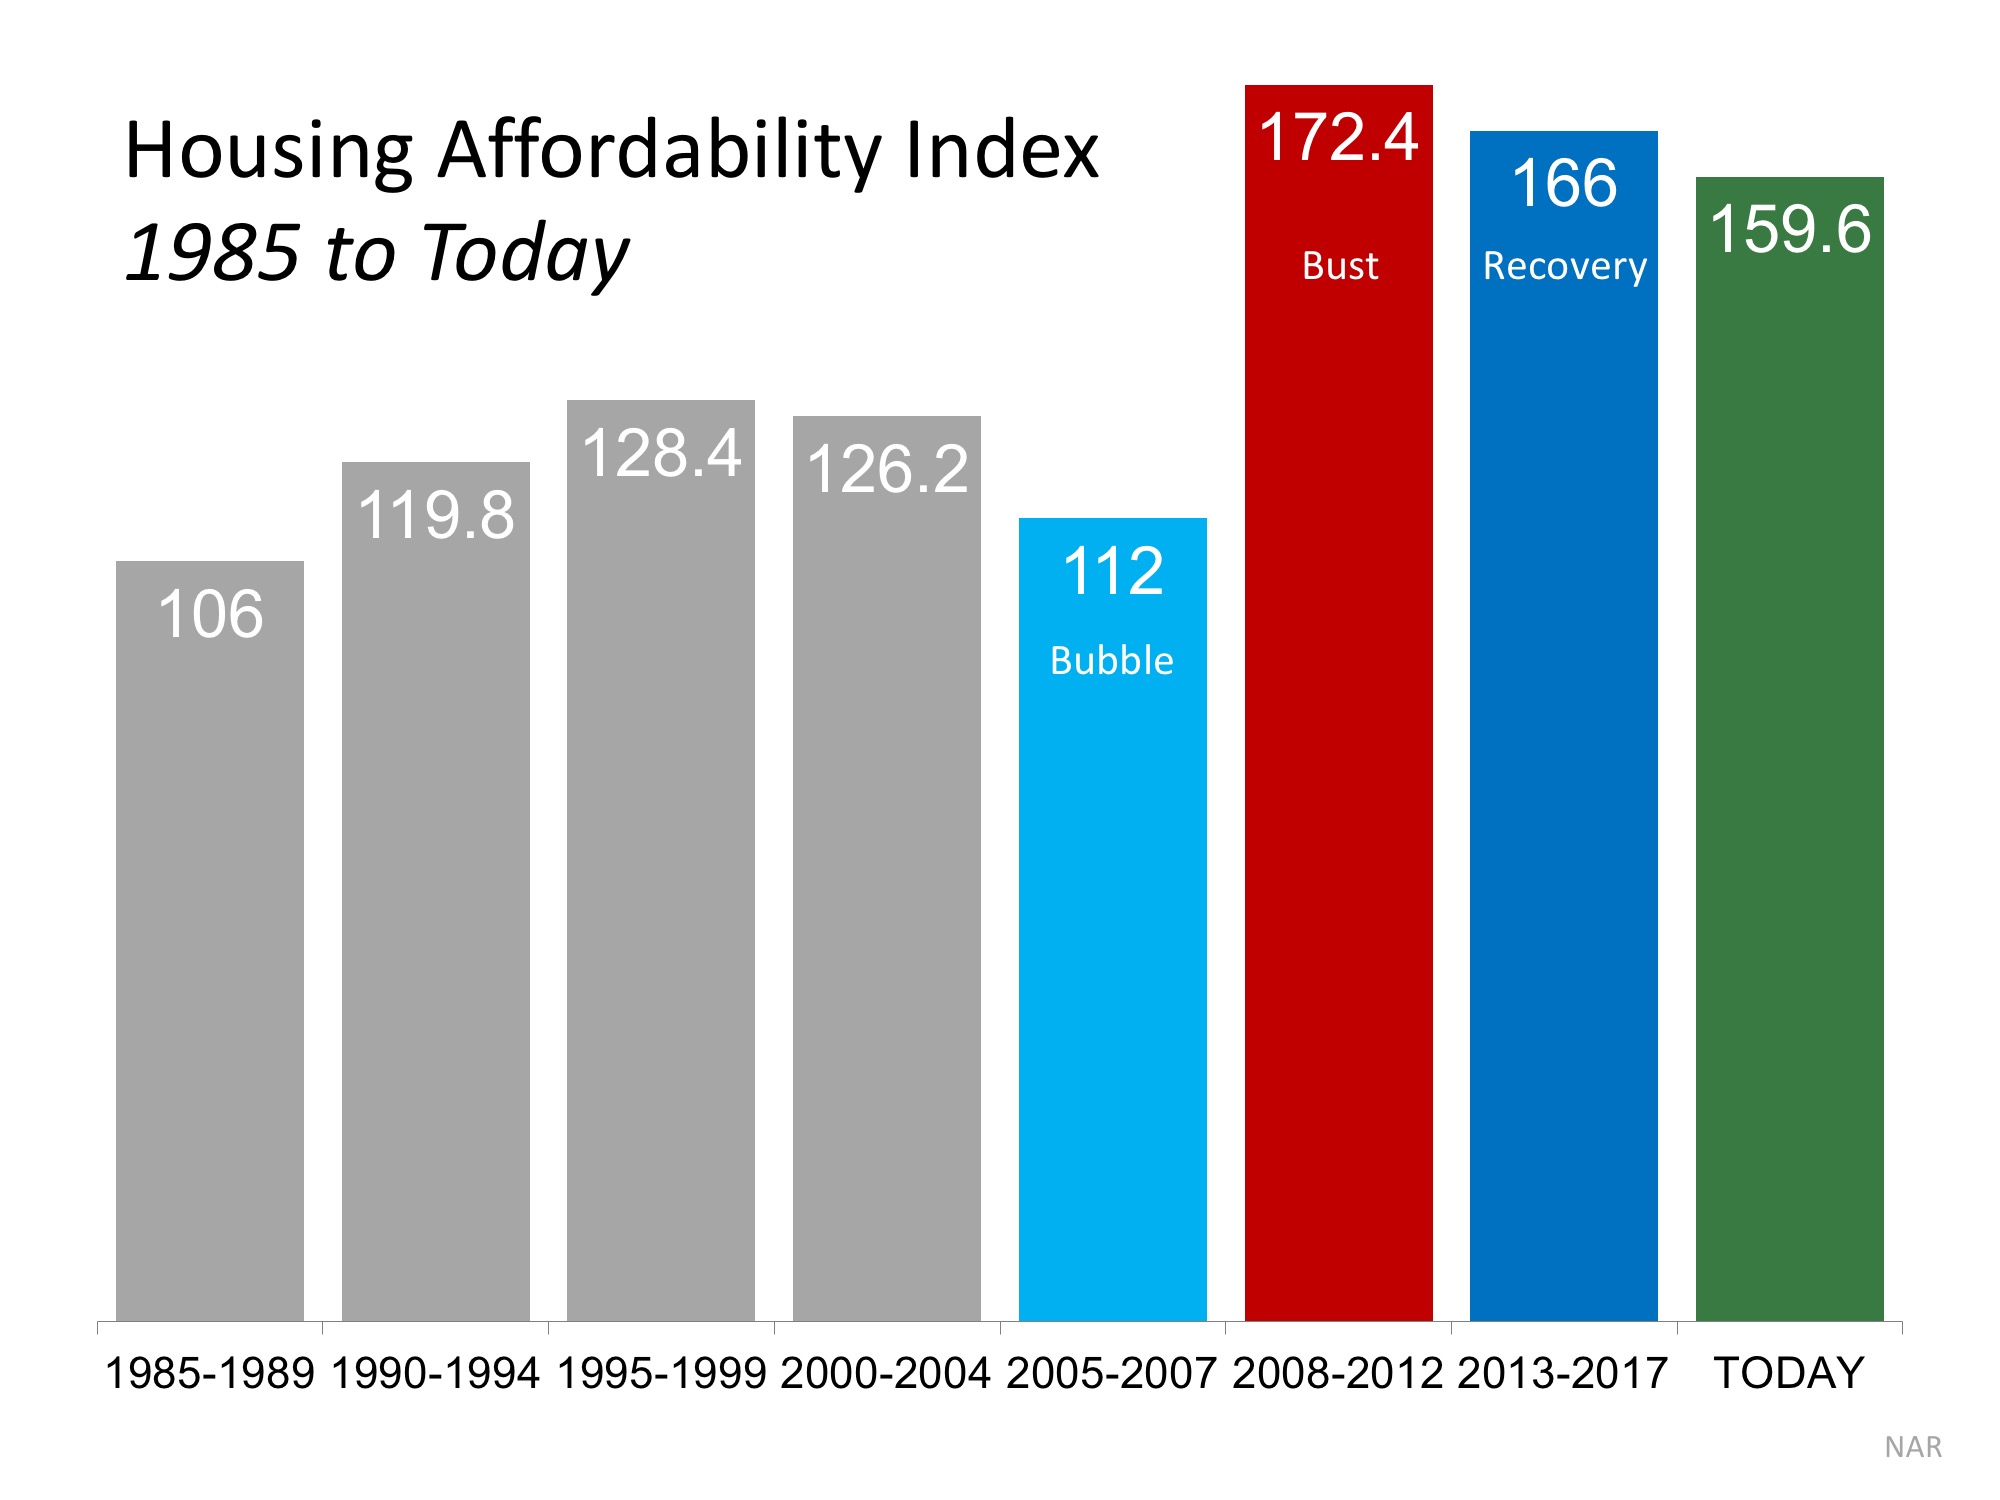
With both house prices and mortgage rates on the rise, there is concern that many buyers may no longer be able to afford a home. However, when we look at the Housing Affordability Index released by the National Association of Realtors, homes are more affordable now than at any other time since 1985 (except for when prices crashed after the bubble popped in 2008).
Bottom Line
After using four key housing metrics to compare today to 2006, we can see that the current market is not anything like the bubble market.

